DISCOVERY PROJECT
Every Graph Tells a Story
OBJECTIVE To learn how to give a verbal summary of a situation described by a graph.
If a picture is worth a thousand words, then a graph is worth at least a few sentences of prose. In fact, a graph can sometimes tell a story much more quickly and effectively than many words. The devastating impact of the stock market crash of 1929 is immediately evident from a graph of the Dow Jones index (DJIA). Such graphs were printed in the newspapers of the time as an effective way of conveying the magnitude of the crash. No words are needed to convey the message in the cartoon below. The graph tells a simple story: Something is way down—perhaps sales, profits, or productivity—and the responsible person is very very worried.
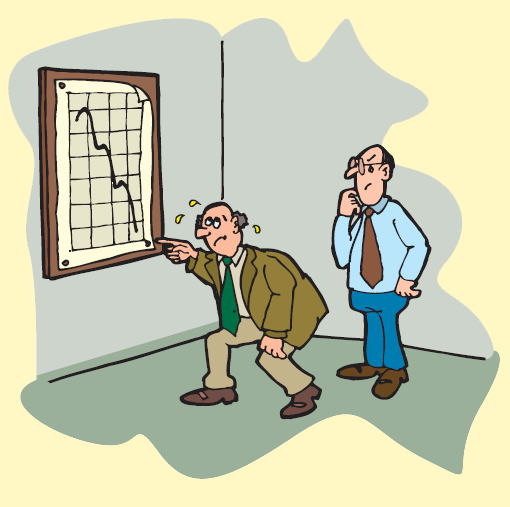
Aardvark Marketing
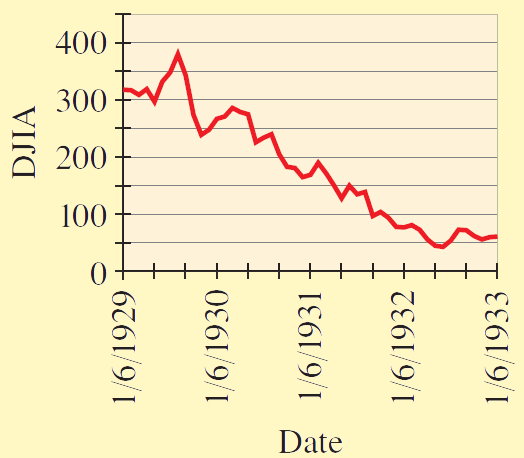
In this exploration we read the stories that graphs tell, and we make graphs that tell stories.
I. Reading a Story from a Graph
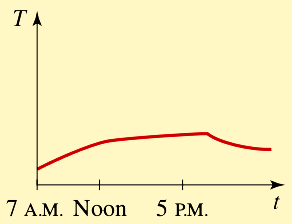
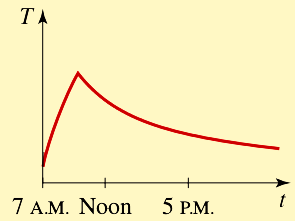
- Four graphs of temperature versus time (starting at 7:00 A.M.) are shown below, followed by three stories.
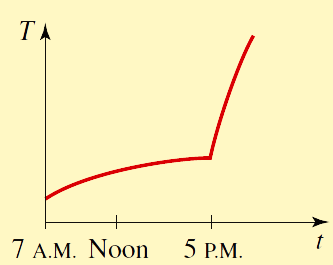
Graph A
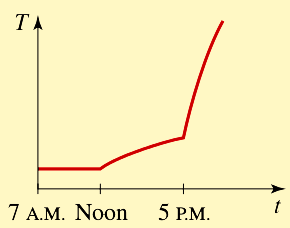
Graph B
Graph C
Graph D
- Match each of the stories with one of the graphs.
- Write a similar story for the graph that didn't match any story.
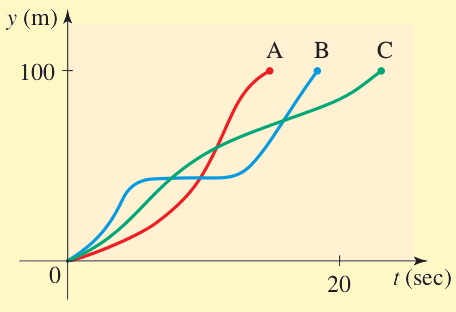
- Three runners compete in a $100$-meter hurdle race. The graph shows the distance run as a function of time for each runner. Describe what the graph tells you about this race. Who won the race? Did each runner finish the race? What do you think happened to Runner $B$?
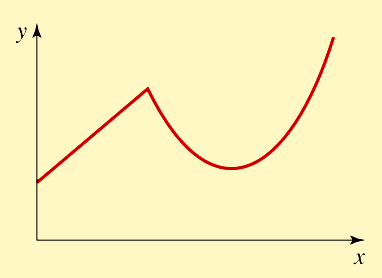
- Make up a story involving any situation that would correspond to the graph shown below.
| Story 1 | I took a roast out of the freezer at noon and left it on the counter to thaw. Then I cooked it in the oven when I got home. |
| Story 2 | I took a roast out of the freezer in the morning and left it on the counter to thaw. Then I cooked it in the oven when I got home. |
| Story 3 | I took a roast out of the freezer in the morning and left it on the counter to thaw. I forgot about it and went out for Chinese food on my way home from work. I put the roast in the refrigerator when I finally got home. |