DISCOVERY PROJECT
Predator/Prey Models
Sine and cosine functions are used primarily in physics and engineering to model oscillatory behavior, such as the motion of a pendulum or the current in an $AC$ electrical circuit. But these functions also arise in the other sciences. In this project, we consider an application to biology—we use sine functions to model the population of a predator and its prey.
An isolated island is inhabited by two species of mammals: lynx and hares. The lynx are predators who feed on the hares, their prey. The lynx and hare populations change cyclically, as graphed in Figure 1. In part $A$ of the graph, hares are abundant, so the lynx have plenty to eat and their population increases. By the time portrayed in part $B$, so many lynx are feeding on the hares that the hare population declines. In part $C$, the hare population has declined so much that there is not enough food for the lynx, so the lynx population starts to decrease. In part $D$, so many lynx have died that the hares have few enemies, and their population increases again. This takes us back to where we started, and the cycle repeats over and over again.
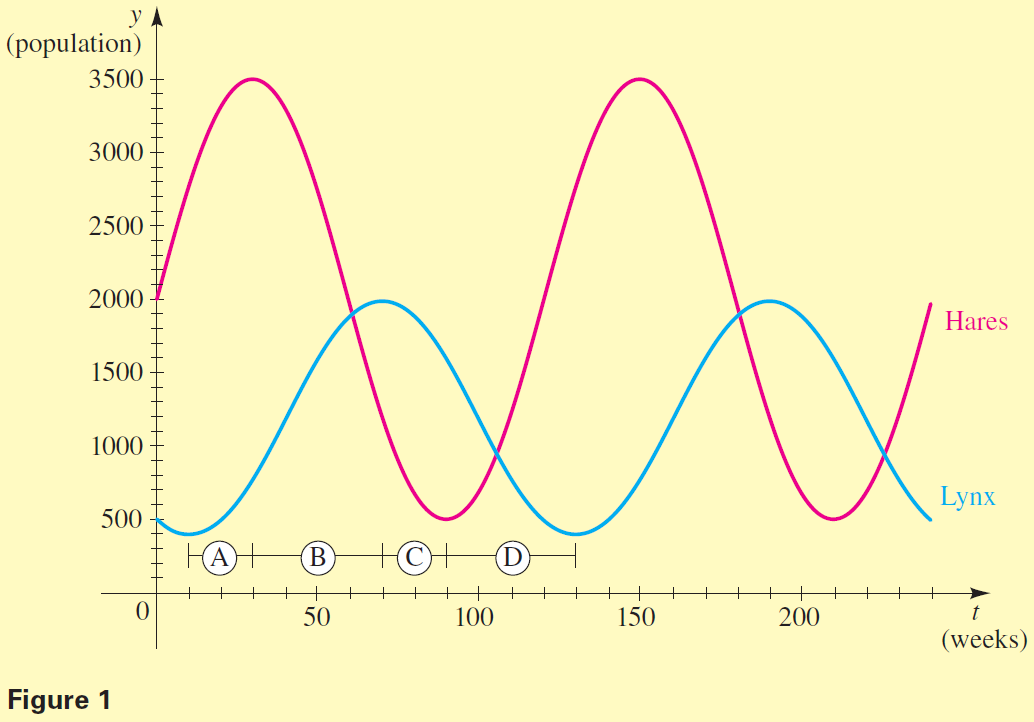
The graphs in Figure 1 are sine curves that have been shifted upward, so they are graphs of functions of the form $$y = a \; \sin \; k(t - b) + c$$
Here $c$ is the amount by which the sine curve has been shifted vertically. Note that $c$ is the average value of the function, halfway between the highest and lowest values on the graph. The amplitude $|\; a \; |$ is the amount by which the graph varies above and below the average value (see Figure 2).
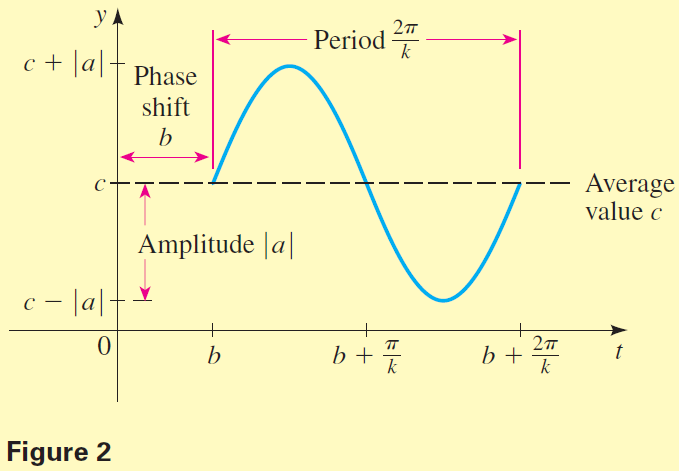
$$y = a \; \sin \; k(t - b) + c$$
- Find functions of the form $y = a \; \sin \; k(t - b) + c$ that model the lynx and hare populations graphed in Figure 1. Graph both functions on your calculator and compare to Figure 1 to verify that your functions are the right ones.
- Add the lynx and hare population functions to get a new function that models the total mammal population on this island. Graph this function on your calculator, and find its average value, amplitude, period, and phase shift. How are the average value and period of the mammal population function related to the average value and period of the lynx and hare population functions?
- A small lake on the island contains two species of fish: hake and redfish. The hake are predators that eat the redfish. The fish population in the lake varies periodically with period $180$ days. The number of hake varies between $500$ and $1500$, and the number of redfish varies between $1000$ and $3000$. The hake reach their maximum population $30$ days after the redfish have reached their maximum population in the cycle.
- Sketch a graph (like the one in Figure 1) that shows two complete periods of the population cycle for these species of fish. Assume that $t = 0$ corresponds to a time when the redfish population is at a maximum.
- Find cosine functions of the form $y = a \; \cos \; k(t - b) + c$ that model the hake and redfish populations in the lake.
- In real life, most predator/prey populations do not behave as simply as the examples we have described here. In most cases, the populations of predator and prey oscillate, but the amplitude of the oscillations gets smaller and smaller, so that eventually both populations stabilize near a constant value. Sketch a rough graph that illustrates how the populations of predator and prey might behave in this case.